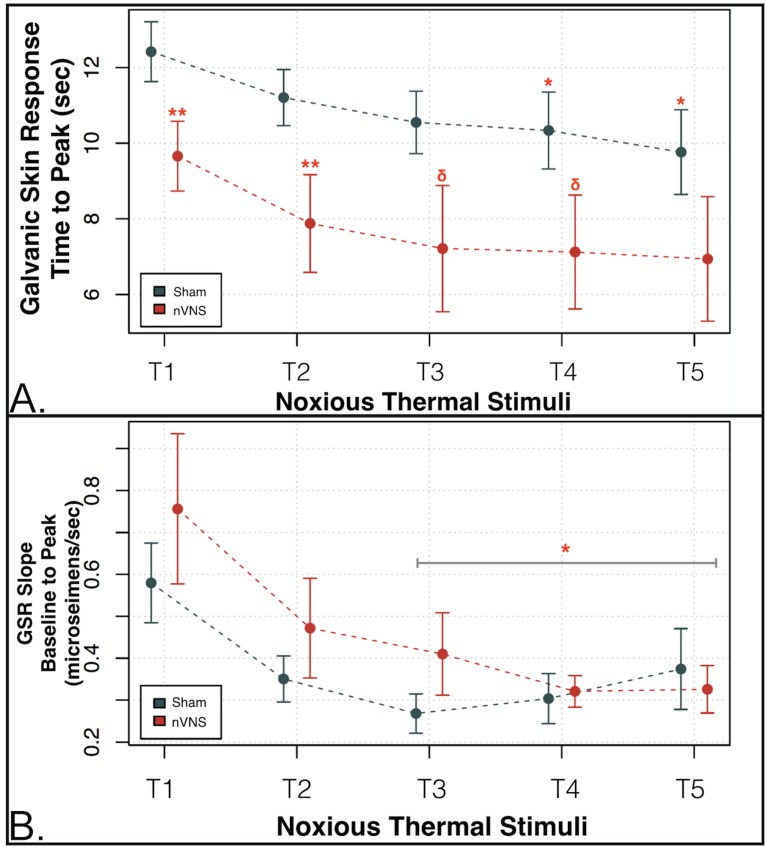
Fig 2. nVNS vs sham autonomic measures of sympathetic tone galvanic skin response (GSR) with noxious thermal challenge.
(A) The time to peak galvanic skin response (GSR) measured in seconds after the application of each of the noxious thermal stimuli was significantly reduced in the nVNS group for noxious thermal stimuli 1 and 2 (T1 and T2) (**p < .05) compared with the sham group, and approached significance for T3 and T4 (δp < .09). Mixed-model regression showed that the combined (T1-T5) time to peak GSR in the nVNS group was significantly shorter compared with the sham group (p < .02). (B) The GSR slope (in microsiemens) from the baseline GSR (prior to the application of each noxious thermal stimulus) to the peak GSR (accompanying each noxious thermal stimulus) was measured in each group. The slope from the baseline GSR to the peak response decreased in both groups with each successively applied noxious thermal stimulus from T1 to T3. However, whereas the nVNS group showed a negative average slope to peak GSR of -0.0461 from T3 to T5, the sham group showed a positive average slope to peak GSR of 0.049 from T3 to T5. The between-group difference (group x time interaction = -0.09508) for T3 to T5 was significant at *p < .05. Red circles = nVNS group. Blue circles = sham group.

