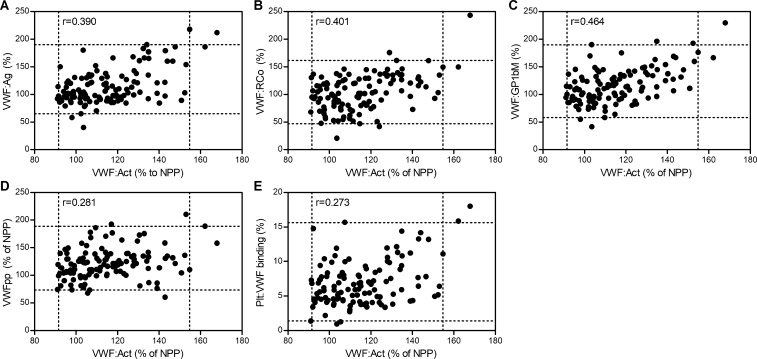
Fig 3. Correlation of active VWF with other VWF parameters.
Scatterplots and corresponding Spearman rank correlations (r) between active VWF assay (VWF:Act) and (A) VWF:Ag, (B) VWF:RCo, (C) VWF:GP1bM, (D) VWFpp and (E) Plt:VWF binding. Dotted lines delineate reference intervals determined in this study, with the centre square containing 95% of values. Spearman rank correlation coefficients (r) are indicated in the upper left corner of each panel.

