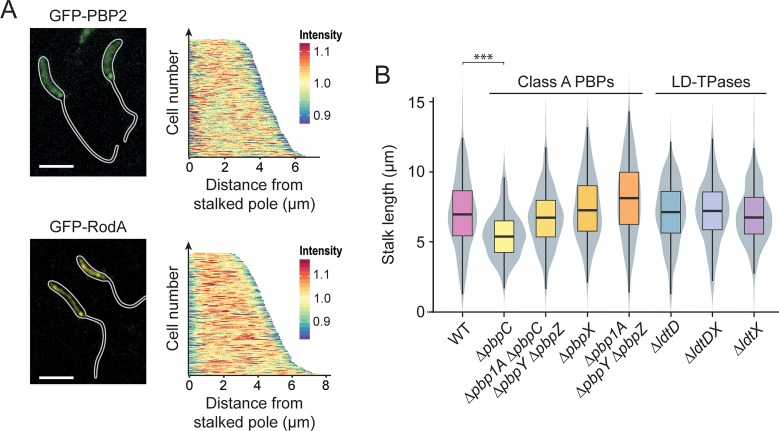
Fig 5. Participation of PG biosynthetic enzymes in stalk elongation.
(A) Localization of GFP-PBP2 and GFP-RodA in strains MAB244 (pbp2::gfp-pbp2) and MAB405 (Pxyl::Pxyl-gfp-rodA), respectively, after 24 h of cultivation in M2G-P. The demograph shows the fluorescence profiles of a random subpopulation of cells sorted according to cell length (GFP-PBP2: n = 227, GFP-RodA: n = 205). (B) Distribution of the stalk lengths in populations of mutants lacking specific PG synthases. Shown are the results obtained for MT286 (ΔpbpC), JK305 (ΔpbpA1 ΔpbpC ΔpbpY ΔpbpZ), KK1 (ΔpbpX), KK12 (Δpbp1A ΔpbpY ΔpbpZ), AZ137 (ΔldtD), AZ138 (ΔldtDX), and AZ140 (ΔldtX) after 24 h of growth in M2G-P medium. Data are represented as box plots, with the horizontal line indicating the median, the box the interquartile range and the whiskers the 2nd and the 98th percentile (n = 208 per strain). In addition rotated kernel density plots (grey) are depicted for each dataset to indicate the distribution of the raw data (*** p < 10−6; t-test). See S1 File for the raw data.

