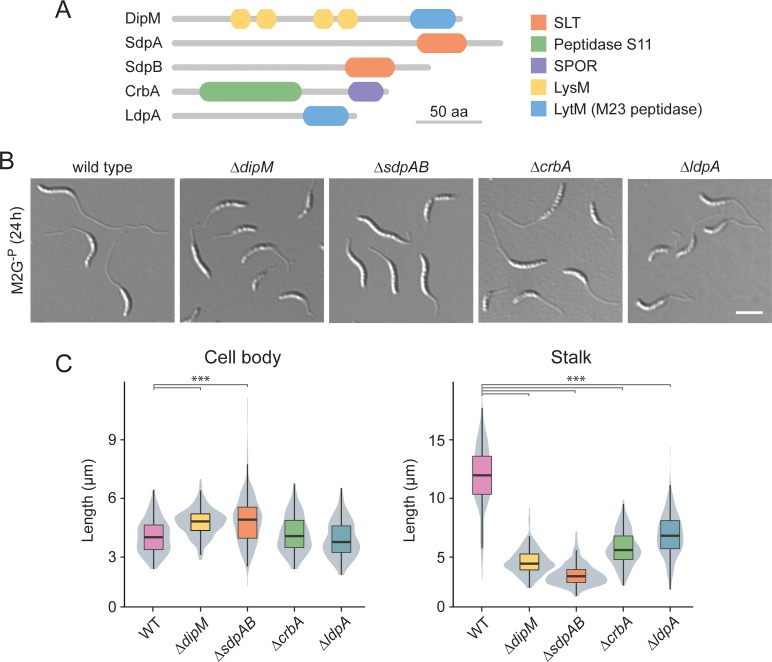
Fig 6. Participation of autolytic factors in stalk elongation.
(A) Domain structure of selected components of the autolytic machinery of C. crescentus. (B) DIC micrographs of mutant cells exhibiting a stalk elongation defect. Shown are strains MT258 (ΔdipM), AZ22 (ΔsdpAB), AM376 (ΔcrbA), and AM364 (ΔldpA) in comparison to NA1000 (WT) after 24 h of cultivation in M2G-P medium. (C) Distribution of the cell body and stalk lengths in populations of strains MT258, AZ22, AM376, and AM364 after growth in M2G-P for 24 h. The values obtained are shown as box plots, with the horizontal line indicating the median, the box the interquartile range and the wiskers the 2nd and the 98th percentile (n = 208 per strain). In addition rotated kernel density plots (grey) are depicted for each dataset to indicate the distribution of the raw data (*** p < 10−6; t-test). See S1 File for the raw data.

