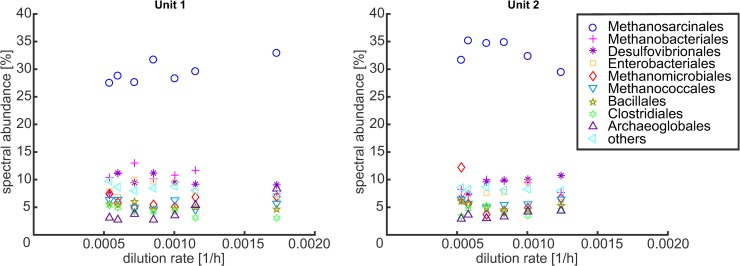
Fig 7. Spectral abundance for different taxonomic orders in the ethanol enrichment culture for different dilution rates.
Spectral counts assigned to the superkingdom of virus or eukaryota and spectra not assigned to any taxonomic order were not considered; taxonomic orders which reached less than 5% in every sample were combined in ‘others’.

