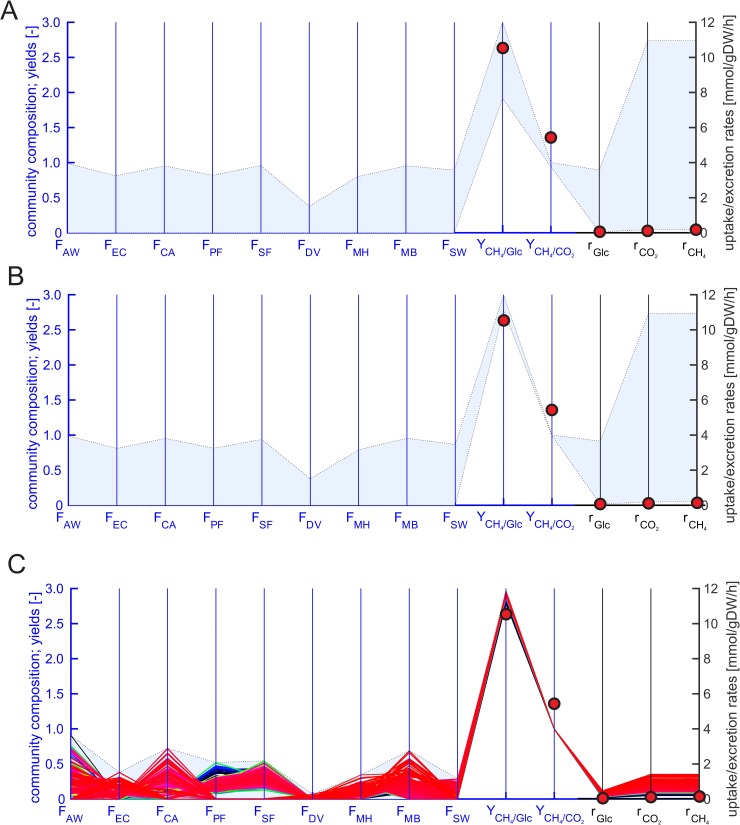
Fig 8.
Community composition (F: fractional biomass abundance, AW: A. woodii, EC: E. coli, CA: C. acetobutylicum, PF: P. freudenreichii, SF: S. fumaroxidans, DV: D. vulgaris, MH: M. hungatei, MB: M. barkeri, SW: S. wolfei), methane yield (YCH4/Glc), methane to CO2 ratio: (YCH4/CO2)) and metabolic rates (rGlc: glucose uptake, rCO2: CO2 excretion, rCH4: methane excretion) for the bilinear model (A), linearized full model (B) and the reduced model (C). The blue axes correspond to the biomass abundances, methane yield and methane to CO2 ratio whereas the black axes to the exchange rates. In the bilinear model, the ranges (light blue area) were obtained by nonlinear optimization, in the linear model with FVA. For the reduced model, we computed the EFVs (solid colored lines, colored from red (highest methane production rate) via orange, yellow, green, cyan and blue to black (lowest methane production rate). Additionally, the experimental data (average from two reactors) are plotted (red circles) in all three cases. In the linear (full and reduced) models, μc was set to 0.0067 h-1 corresponding to the dilution rate of the experiment.

