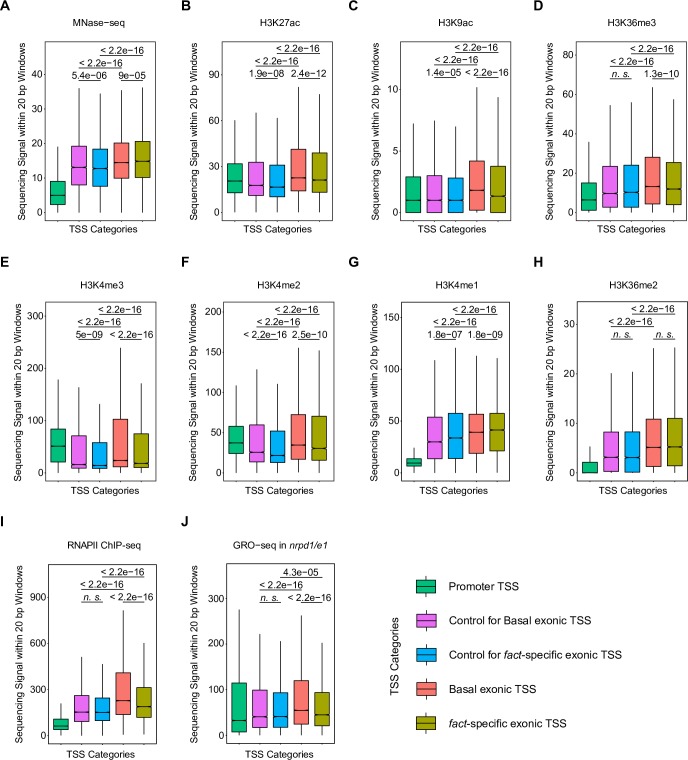
Fig 6. H3K4me1 is enriched at FACT-repressed TSS positions.
Boxplots show the distribution of median ChIP-seq, GRO-seq and MNase-seq signals within 20 bp windows centered at the following positions: i) Promoter TSS (green); ii) Control exonic positions in genes with basal exonic TSS (purple); iii) Control exonic position in genes with fact-specific TSS (blue); iv) Basal exonic TSS (salmon); v) fact-specific exonic TSS (olive). The notch denotes the median value, hinges denote quartiles and whiskers show the spread of non-outlier values (found within 1.5*IQR from the respective quartile). The p-values were calculated by Wilcoxon test. The following datasets were included: (A) MNase-seq; (B) H3K27ac; (C, D) H3K9ac and H3K36me3; (E, F, G) H3K4me3, H3K4me2 and H3K4me1; (H) H3K36me2; (I) RNAPII ChIP-seq; (J) GRO-seq.

