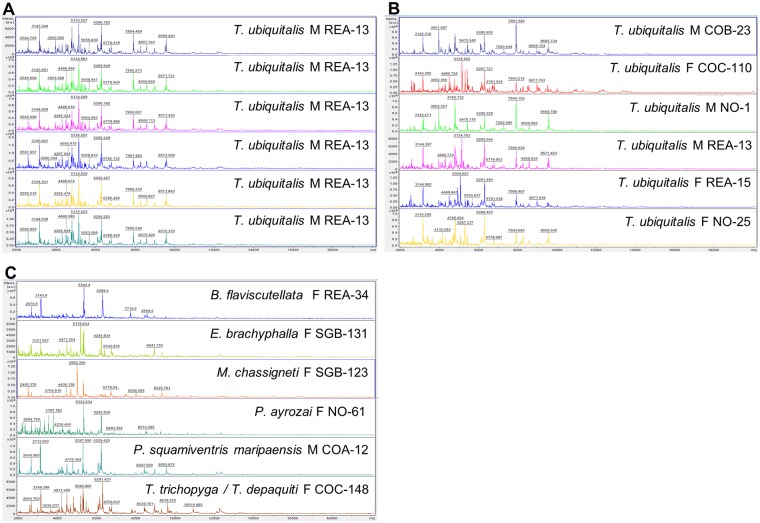
Fig 3. Example of mass spectra protein extraction from thorax with legs and wings of French Guiana sand flies included in the reference library.
(A). Spectra of various extract deposits from a single specimen of T. ubiquitalis. (B). Spectra of various specimens of T. ubiquitalis. (C) Spectra of different species. Annotations of spectra represent mass peaks in Daltons. M: male, F: female. AU, arbitrary units; m/z, mass to charge ratio.

