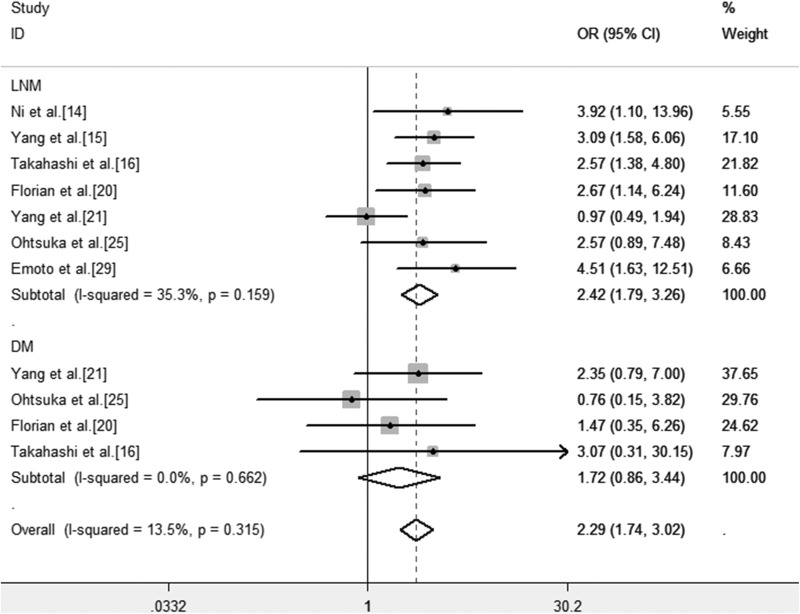
Figure 4.
Forest plots of OR for the association between TN-C expression level and clinicopathological features in patients with cancer. Note: Weights are from fixed effects analysis. CI indicates confidence interval; DM, distant metastasis; LNM, lymph node metastases; OR, odds ratios; TN-C, tenascin-C.

