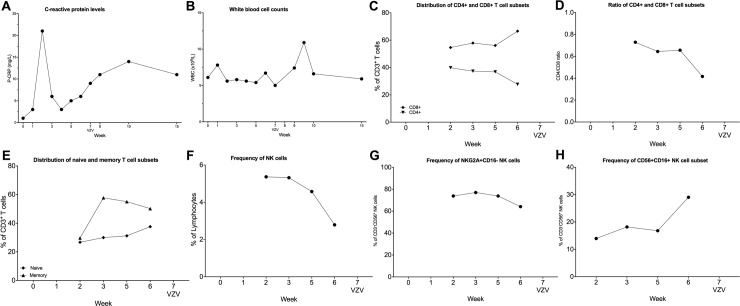
Fig 6. Clinical and immunological parameters from a patient with VZV reactivation during dara treatment.
(A-B): The laboratory parameters CRP (A) and WBC at admission during the Dara treatment and VZV reactivation are shown. (C-H) Peripheral blood samples were collected from patients throughout the Dara treatment. PBMCs were stained with lymphoid lineage markers and analyzed by flow cytometry, as described in experimental procedures. Frequencies of T cell and NK cells subsets are depicted. (C) percentages of CD8+ and CD4+ T cells and (D) CD4/CD8 ratio during Dara treatment (E) distribution of memory (CD45RA-CD45RO+) and naïve (CD45RA+CD45RO-) T cell subpopulation. In (F), total CD3-CD56+ NK cells as the percentage of lymphocytes and (G) CD56+CD16-NKG2A+ NK cells as the percentage of CD3-CD56+ NK cells are shown. (H) shows frequency of CD56+CD16- as the percentage of total CD3-CD56+ NK cells.

