
Fig. 5.
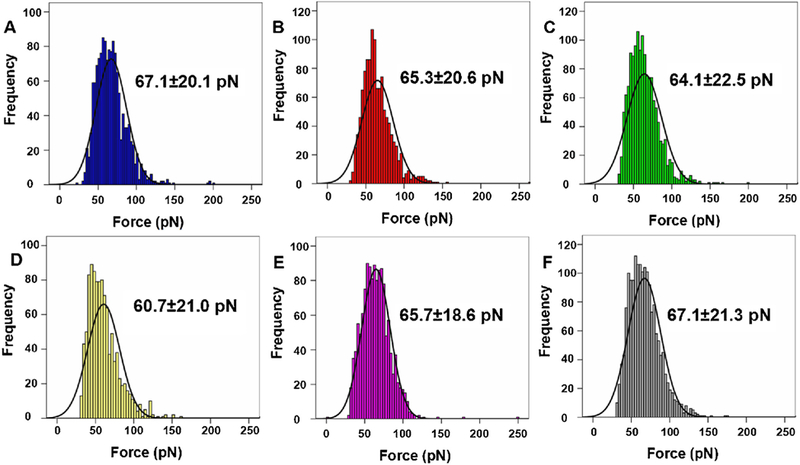
Unbinding forces measured on the surface of KYSE-150 cells by EGF-functionalized AFM tips. Histogram of unbinding forces of EGF-EGFR complexes obtained on (A) control KYSE-150 cells, (B) 10 μM oridonin treated KYSE-150 cells, (C) 30 μM oridonin treated KYSE-150 cells, (D) 50 μM oridonin treated KYSE-150 cells, (E) 2.5 μM MNAC and 50 μM oridonin treated KYSE-150 cells, (F) 2.5 μM MNAC treated KYSE-150 cells. The black lines in the histograms are the corresponding Gaussian fits. Data was expressed as mean ± S.D., n > 6000.