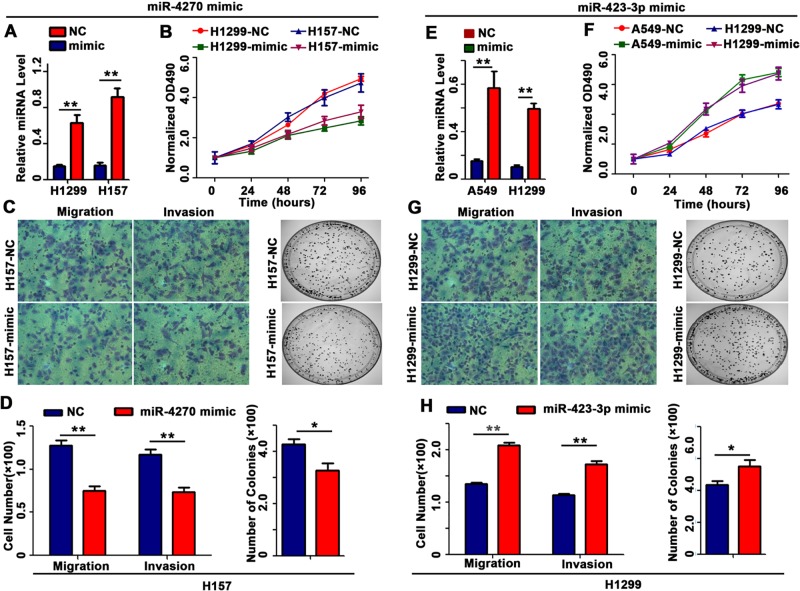
Fig 4. Cell proliferation, colony formation, migration, and invasion.
(A) Quantification of miR-4270 expression after transfection with the miR-4270 mimic. (B) The cell growth curve measured by MTS after the transfection of the miR-4270 mimic. All the ODs at 490 were normalized to the starred value (at 0 h). (C–D) Representative images and quantitative results for the migration and colony formation assays after the transfection with the miR-4270 mimic. (E) Quantification of miR-423-3p expression after the transfection of the miR-423-3p mimic. (F) The cell growth curve, as measured by MTS, after the transfection of the miR-423-3p mimic. All the ODs at 570 were normalized to the starred value (at 0 h). (G–H) Representative images and quantitative results for the migration and colony formation assays after the transfection with the miR-423-3p mimic. Data are presented as the means ± SD of three experiments. ** P < 0.01 and * P < 0.05.

