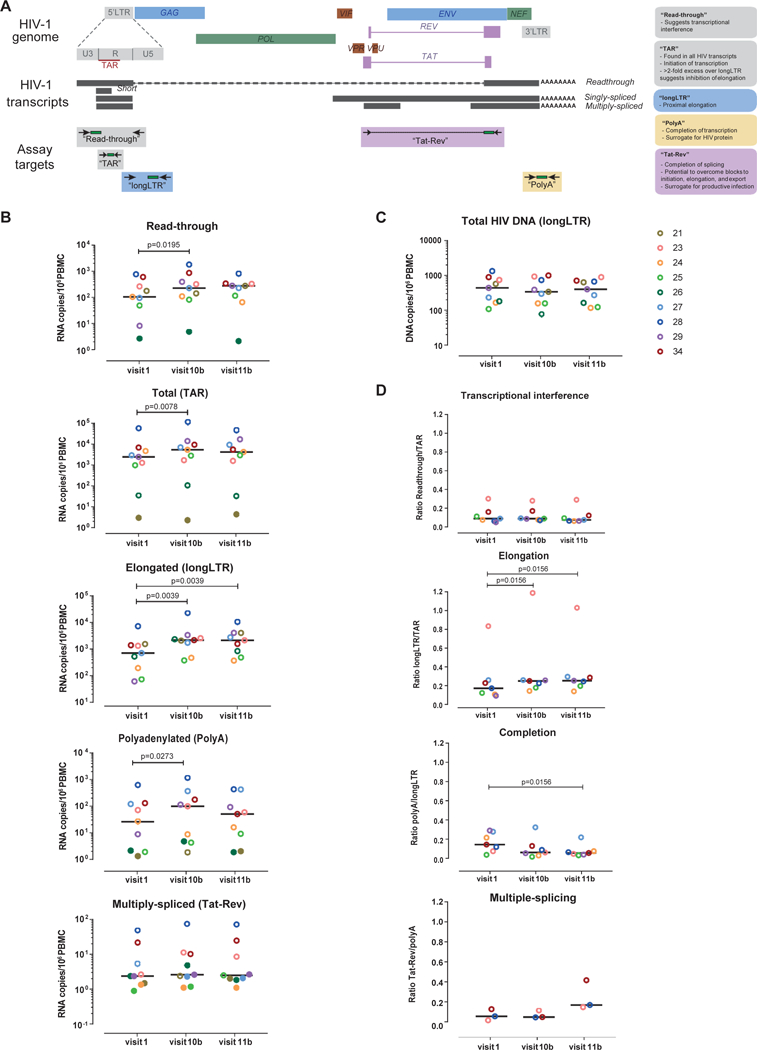
Figure 1. HIV transcriptional profile, HIV DNA, and blocks to HIV transcription before and after romidepsin therapy.

(A) Diagram of the assays used to characterize the HIV transcriptional profile; (B) Dynamics of each HIV transcript per million PBMCs; (C) Dynamics of total HIV DNA; and (D) Changes in transcriptional interference, elongation, completion, and multiple-splicing. Each color represents a different individual from the REDUC part B study; bars represent medians. Determinations below the limit of quantification (LOQ) are represented as solid dots.
