
Fig. 3. Tie2 deletion in adult ECs exacerbates CNV formation and hinders regeneration of choriocapillaris surrounding the CNV lesions.
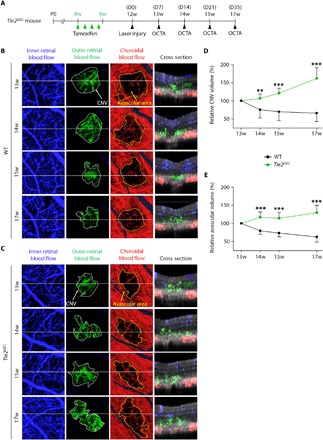
(A) Diagram of schedule for EC-specific depletion of Tie2 in 8-week-old mice, induction of CNV after 4 weeks (D0), and intravital OCTA at D7, D14, D21, and D35 using Tie2iΔEC mice. (B and C) En face OCT angiograms and selected cross-sectional OCT angiograms of the locations indicated by white dotted lines showing inner retinal blood flow (blue), outer retinal blood flow (green), and choroidal blood flow (red) acquired by longitudinal OCTA imaging of eyes. En face angiogram of the outer retina showing the CNV (area demarcated by the white dotted boundary) and the choroid with avascular space (area demarcated by the yellow dotted boundary) surrounding the CNV. (D and E) Temporal changes in relative CNV volume (D) and avascular volume surrounding the site of laser photocoagulation (E). Error bars represent means ± SD. Each group, n = 10. **P < 0.005, ***P < 0.001 versus WT by unpaired Student’s t test.