
Fig. 5. ABTAA promotes regeneration of choriocapillaris surrounding the site of laser photocoagulation in the treatment phase.
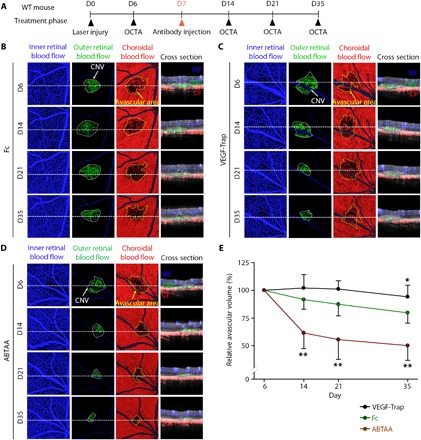
(A) Diagram of schedule for induction of CNV at D0, intravitreal administration of Fc, VEGF-Trap, or ABTAA (5 μg each) at D7 and intravital OCTA at D6, D14, D21, and D35 (treatment phase). (B to D) En face OCT angiograms and selected cross-sectional OCT angiograms of the locations indicated by white dotted lines showing inner retinal blood flow (blue), outer retinal blood flow (green), and choroidal blood flow (red) acquired by longitudinal OCTA imaging of eyes treated with Fc, VEGF-Trap, and ABTAA. En face angiogram of the outer retina showing the CNV (area demarcated by the white dotted boundary) and the choroid with the avascular space (area demarcated by the yellow dotted boundary) surrounding the CNV. (E) Temporal changes in relative avascular volumes surrounding the site of laser photocoagulation. Error bars represent means ± SD. Each group, n = 11. *P < 0.05, **P < 0.005 versus Fc by one-way ANOVA followed by Student-Newman-Keuls post-test.