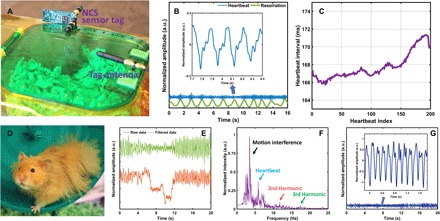
Fig. 3. The vital sign monitoring of a conscious pet hamster.

(A) Illustrations of the experimental setup when the hamster was in its sleeping quarter. (B) Heartbeat (blue) and respiration (green) signals demodulated from NCS. The inset shows the heartbeat waveform details around the ninth second. (C) Heartbeat interval extraction for about 30 s. (D) Experimental setup when the hamster was running in the exercise wheel during the measurements. The NCS tag antenna was placed at the back of the wheel outside the wire cage. (E) Demodulated NCS raw data (red) and data after bandpass filtering (green) for 20 s. (F) The spectrum of the NCS signal indicates the frequency components of the body motion and the heartbeat as well as its harmonics. (G) Reconstructed time-domain heartbeat waveform after the equalized comb filtering. The inset shows the waveform details when the hamster was under the intermittent rest with less motion interference. (The pictures were taken by Xiaonan Hui, School of Electrical and Computer Engineering, Cornell University, Ithaca, NY 14853, USA.)
