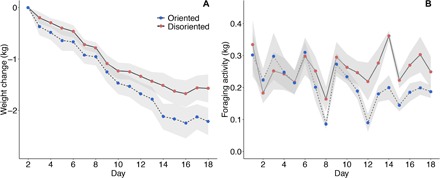
Fig. 1. Weight data over the course of the experiment.

(A) Cumulative weight change over the 18-day experimental period (n = 12 colonies). (B) Foraging activity measured as colony weight change between 4 a.m. and 12 p.m. Each point is the mean difference for a treatment on a day. Solid line, disoriented colonies; dashed line, oriented colonies (shaded area, SE).
