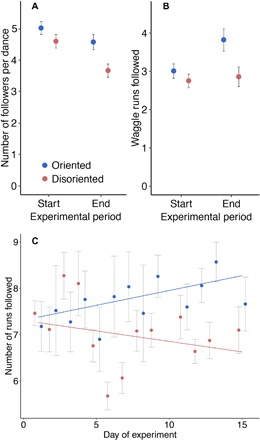
Fig. 3. Following behavior change in E1 and E2 for oriented colonies (blue) and disoriented colonies (red).

(A) Average number of dance followers per dance in the first 2 days (start) and in the last 2 days (end) in E1 (mean ± SE). (B) Average number of waggle runs followed by dance followers at the start and end in E1 (mean ± SE). (C) Number of runs followed by a dance follower in E2 (mean ± SE). Lines were drawn using linear model function.
