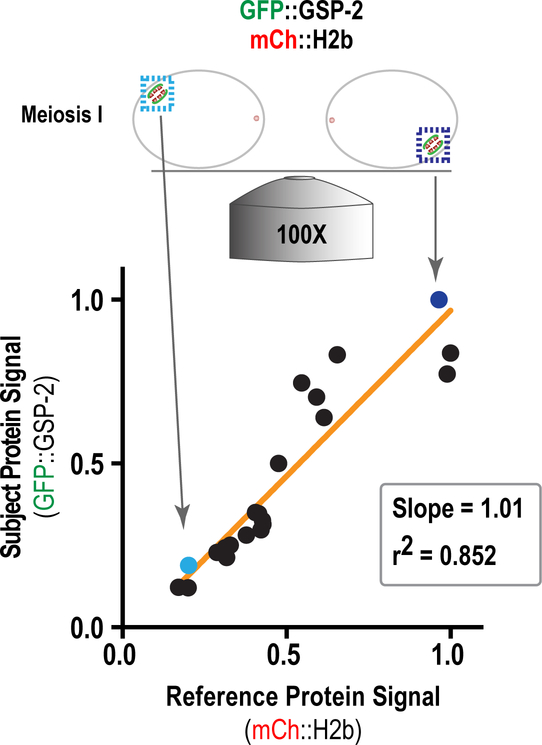
Figure 11. Signal depth correction.
Schematic illustrating method used for depth correction of fluorescence signal intensity. GFP::GSP-2 signal correlates with mCh::H2b signal, thus intensity changes in GFP signal due to variation in distance between the objective and object can be corrected ratio to mCh signal.

