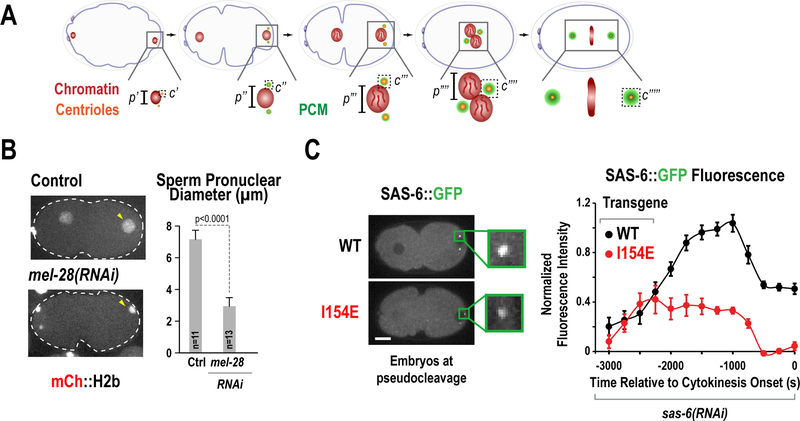
Figure 6. Quantification of nuclear reformation and centriole assembly.
(A) Schematics illustrating two early events in the C. elegans embryo: nuclear reformation after exit from meiosis II and centriole assembly. Parameters such as p=pronuclear diameter and c=centriole intensity can be measured over time. (B) Measuring male pronuclear diameter in either control embryos or embryos depleted of the nucleoporin mel-28 (Adapted from Hattersley et al. 2016). (C) Measuring SAS6 accumulation at centrioles upon centriole assembly. Embryos depleted of endogenous SAS-6 by RNAi were expressing a reencoded version of SAS-6::GFP, either wild-type or a mutant deficient in centriole assembly (I154E) and centriole intensities were quantified over time (adapted from Lettman et al. 2013)

