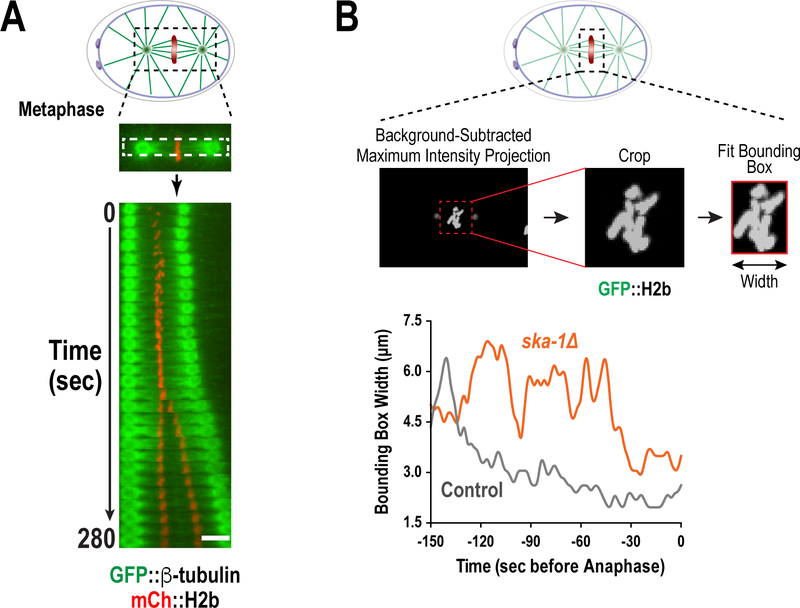
Figure 7. Methods to evaluate kinetochore-microtubule interactions and chromosome alignment during mitosis.
(A) Kymographs illustrating chromosome and spindle dynamics were produced by taking visual sections through the spindle, oriented from spindle pole to spindle pole, during a temporal progression. (B) The minimal bounding box (MMB) method to quantify chromosome dynamics during mitosis. A bounding box was fit to the minimal area of chromosomes, indicated by a maximum-intensity projection of GFP::H2b signal, and width of this box was plotted over time. (All panels adapted from Cheerambathur et al. 2017)

