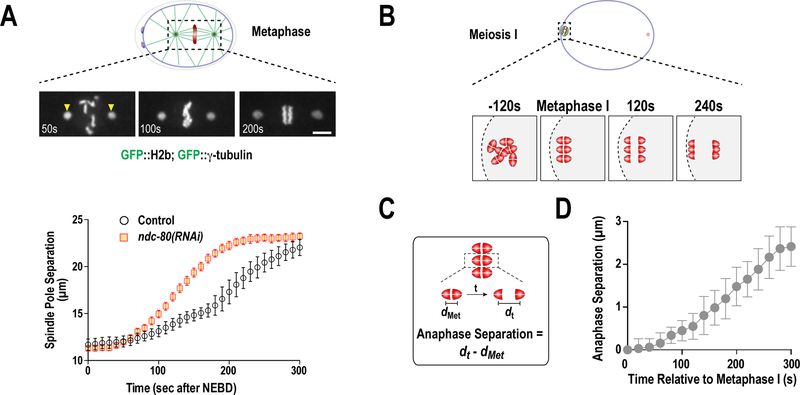
Figure 8. Analysis of mitotic spindle length and meiotic chromosome segregation.
(A) Spindle pole-tracking assay. Distance from the center of spindle-pole to spindle-pole was plotted over time during mitosis to describe changes in spindle length that reflect perturbations in microtubule interactions with chromosomes and/or the cortex (Cheerambathur et al. 2017). (B) Schematic illustrating the process of bivalent chromosome segregation during meiosis I. (C and D) Plot of mean homologous chromosome segregation over time. The distance between the separating homologous chromosomes was measured from the center of each half of the bivalent, positioned in the center of the spindle. The separation of the homologous chromosomes at metaphase (dmet) was subtracted from all values to describe chromosome segregation over time (dt).

