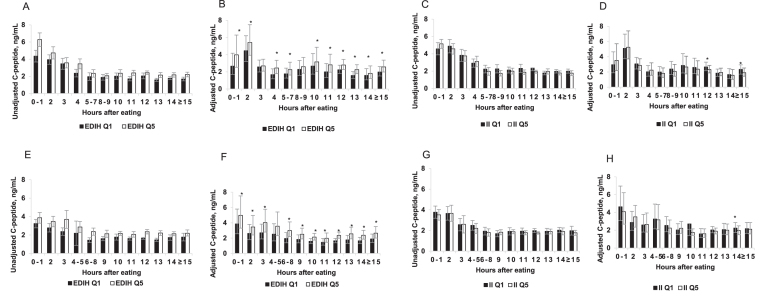
FIGURE 1.
Plasma absolute unadjusted and adjusted C-peptide concentrations among men (A, B, C, D) and women (E, F, G, H) classified in the lowest (Q1) and highest (Q5) quintiles of the EDIH score (A, B, E, F) and the dietary II score (C, D, G, H). Values are means and 95% CIs. *Significant linear trend across quintiles, P-trend < 0.05. The unadjusted concentrations represent observed C-peptide concentrations not statistically transformed. The adjusted concentrations were obtained from 12 separate multivariable-adjusted linear regression models, 1 model for each postprandial duration; controlling for age at blood draw, aspirin/NSAID use, smoking status, chronic diseases/conditions (hypertension, hypercholesterolemia, heart disease, arthritis), and case-control status. Diabetic patients were excluded and both dietary scores were adjusted for energy intake using the residual method. The sample sizes at each postprandial duration were as follows: (Men) 0–1 h, n = 287; 2h, n = 348; 3 h, n = 244; 4 h, n = 258; 5–7 h, n = 254; 8–9 h, n = 200; 10 h, n = 333; 11 h, n = 205; 12 h, n = 833; 13 h, n = 256; 14 h, n = 420; and ≥15 h, n = 326. (Women) 0–1 h, n = 240; 2 h, n = 289; 3 h, n = 205; 4–5 h, n = 225; 6–8 h, n = 272; 9 h, n = 304; 10 h, n = 799; 11 h, n = 469; 12 h, n = 1656; 13 h, n = 516; 14 h, n = 753; and ≥15 h, n = 487. EDIH, empirical dietary index for hyperinsulinemia; II, insulin index; NSAID, nonsteroidal anti-inflammatory drug; Q, quintile.

