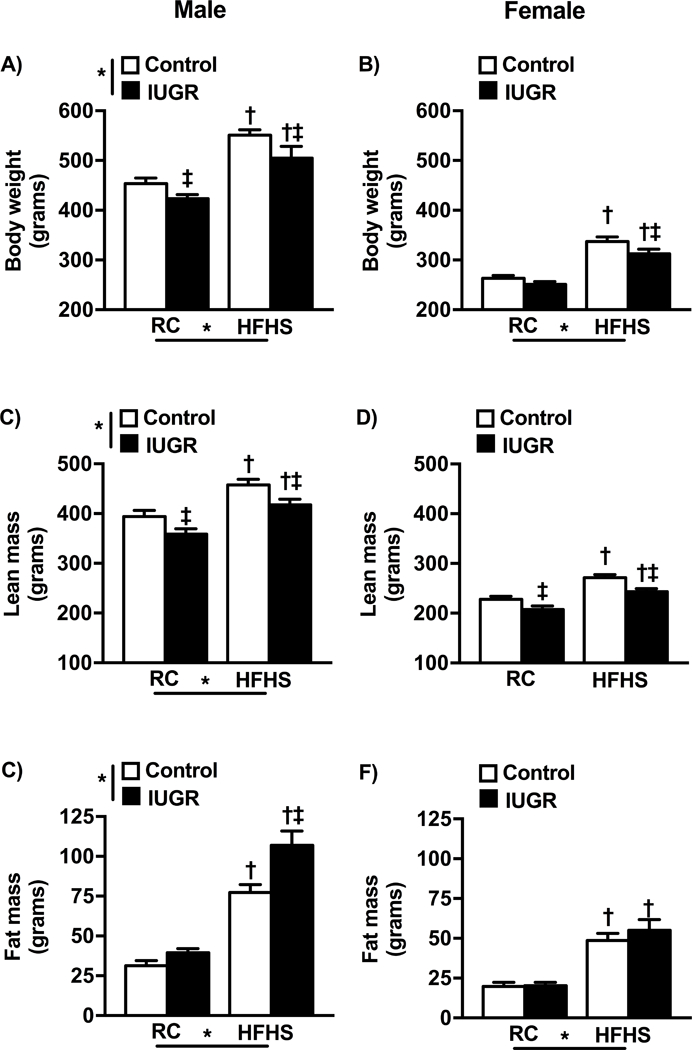
Figure 1.

Body weight (a and b), lean body weight(c and d) and fat mass(e and f) in male and female control and growth-restricted (IUGR) offspring at 6 months of age on regular chow (RC) or an enriched diet high in fat and sugar (HFHS). *P value next to each label represents significance in the effect (P< 0.05), IUGR or HFHS, using two-way Analysis of Variance (ANOVA); †P<0.05 HFHS versus RC in similar group; ‡ P<0.05 control versus IUGR on same diet using Bonferroni post hoc test, (n= 7–12 per group). Data values represent mean±SE.
