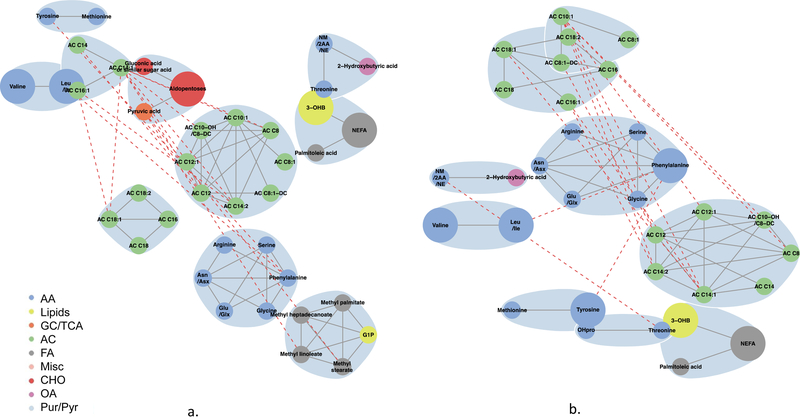
Fig. 5.
Maternal 1 h metabolite subnetworks associated with newborn C-peptide. Subnetwork of maternal 1 h metabolites associated with newborn C-peptide in models 2 (a) and 3 (b). Covariates for each model are as stated in the legend for Fig. 1. Blue shading denotes spinglass communities within the estimated networks. The lines between two nodes (edges) represent dependence among metabolite pairs conditional on all other metabolites in the network according to graphical lasso. Solid edges represent dependencies for metabolites in the same spinglass cluster and red dashed edges represent dependencies for metabolites in different spinglass clusters. Large nodes represent metabolites that are individually significant with newborn C-peptide while small nodes are correlated with an individually significant metabolite. Nodes are coloured by metabolite class (amino acid, lipid, glycolysis/tricarboxylic acid cycle, acylcarnitine, fatty acid, miscellaneous, carbohydrate, organic acid, purine/pyrimidine). AA, amino acid; AC, acylcarnitine; Asn/Asx, asparagine/aspartic acid; CHO, carbohydrate; FA, fatty acid; GC/TCA, glycolysis/tricarboxylic acid cycle; G1P, glycerol-1-phosphate; Glu/Glx, glutamine/glutamic acid; Leu/Ile, leucine/isoleucine; Misc, miscellaneous; NM/2AA/NE, N-methylamine/2-aminobutanoic acid/N-ethylglycine; OA, organic acid; 3-OHB, 3-hydroxybutyrate; OHPro, hydroxyproline; Pur/Pyr, purine or pyrimidine

