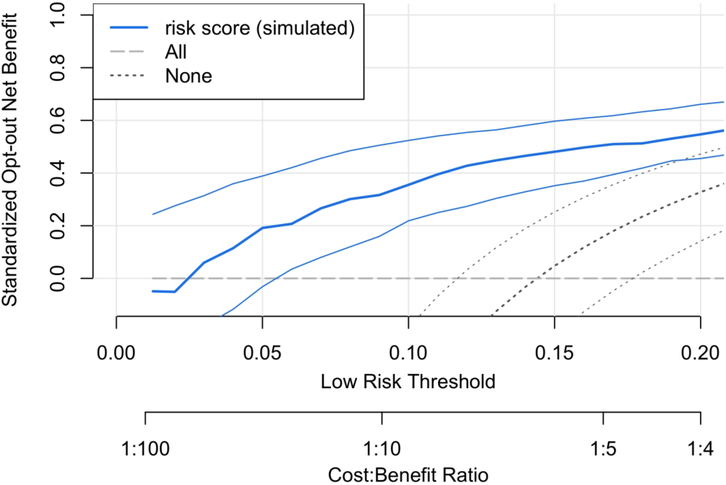
Figure 2.
Opt-out Decision Curve analysis corresponding to Figure 1. Treat-all is the reference policy, and a risk model could be used to opt low-risk patients out of treatment. The analysis shows that the risk model offers an estimated 20%−55% of the maximum possible Net Benefit to the patient population for R=5%−20% compared to perfect prediction. For a pre-specified risk threshold, this opt-out Decision Curve allows an assessment of the evidence in favor of using the risk model over treat-all because the confidence intervals displayed are for risk-based treatment relative to treat-all. This is not possible using the opt-in Decision Curves in Figure 1.

