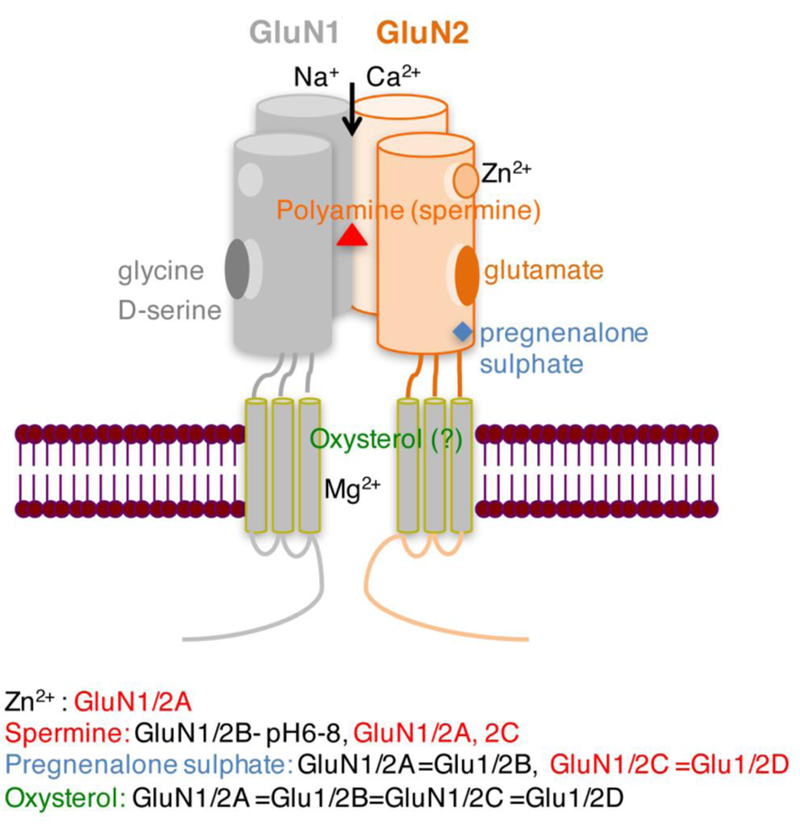
Fig. 1. Schematic of the NMDAR complex.

Binding sites for endogenous ligands and modulators in the N-terminal and ligand-binding domains are illustrated. Inhibitory effects on GluN are depicted in red, stimulatory in black. Different colors depict different binding sites.
