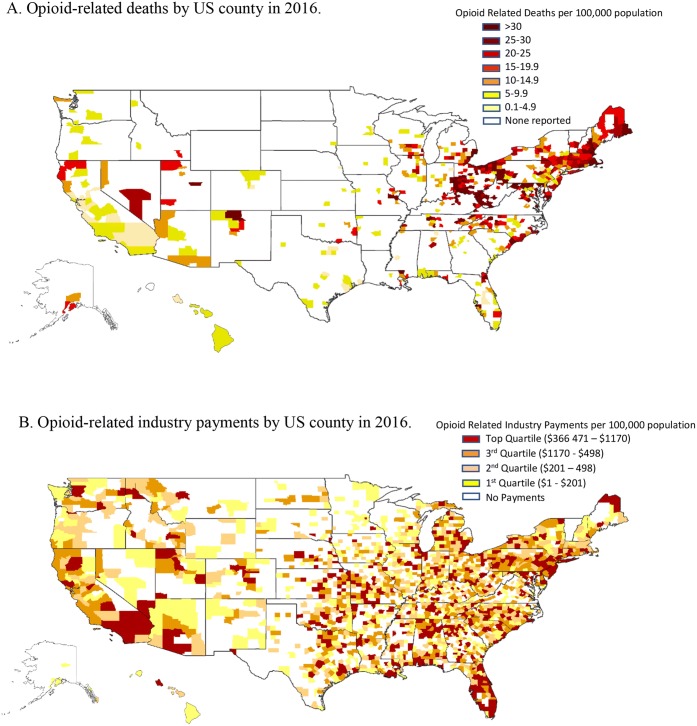
Figure 2.
Mapping of opioid-related deaths and opioid-related industry payments by US county in 2016. a Opioid-related deaths per 100,000 by US county in 2016. b Opioid-related industry payments per capita by US county in 2016. Counties are categorized by quartiles of regions that received opioid-related industry payments. Figure 2 contains poor-quality text in image. Please provide a replacement file.Higher quality file has been uploaded as an attachment. Please replace the old figure 2 with the attached item.

