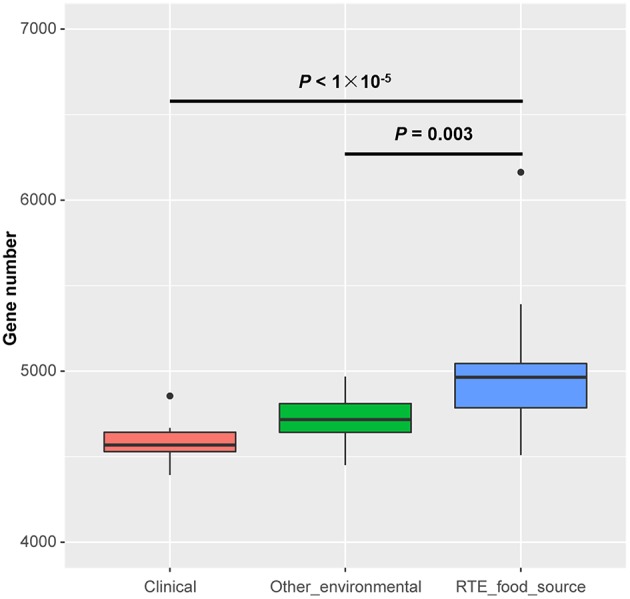
Figure 1.

Genome size differences in Vibrio parahaemolyticus isolates from RTE foods and other sources. Boxes show the medians and upper and lower quartiles; whiskers show the most extreme values within 1.5 times the interquartile range. Clinical: n = 20; Other environmental: n = 19; RTE food sources: n = 27. P-values are obtained according to the one-way analysis of variance.
