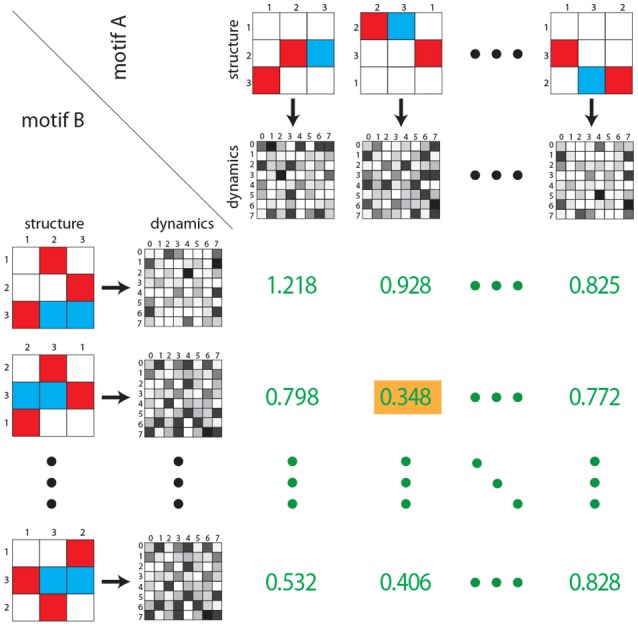
Figure 4.

Dynamical distance between motif classes. As in Figure 3, rows and columns contain the six possible permutations of two given motif classes (structure). For each permutation the corresponding state transition matrix is calculated (gray shaded matrices). Subsequently, for each of the 36 combinations, the Euclidean distance between each pair of state transition matrices is calculated (green numbers). As described in the Methods section, the dynamical distance is defined as the minimum of all 36 Euclidean distances (green number with yellow background). Note that green numbers do not correspond to actual distances, but are for illustration purposes only.
