Figure 2.
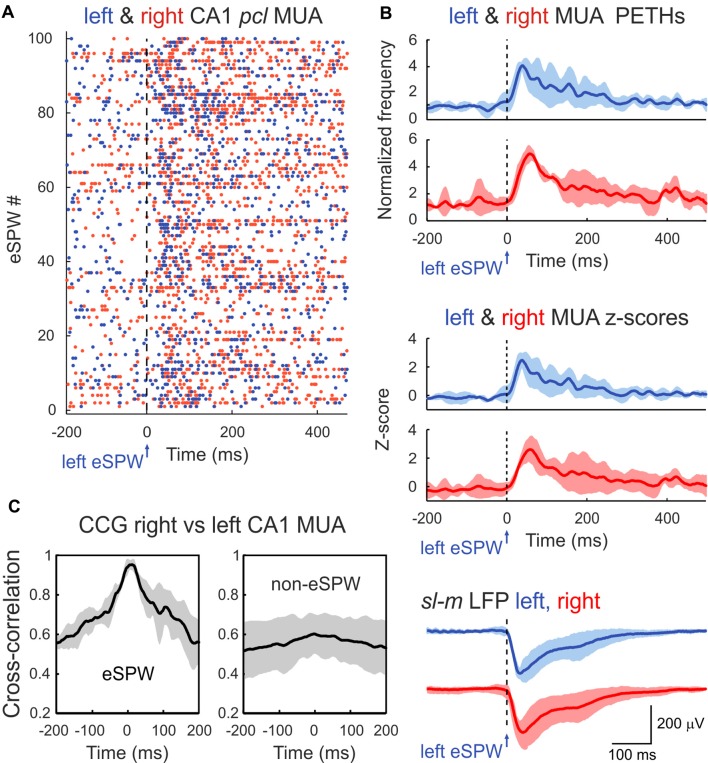
Bilateral synchronization of CA1 MUA during eSPWs. (A) Left eSPW onset-triggered raster plot of CA1 pcl MUA in the left (blue dots) and right (red dots) hippocampus. (B) Left eSPW onset-triggered and normalized to the baseline MUA peri-event time histograms (PETHs) in left and right hippocampi (top), corresponding MUA z-scores (middle) and average LFP (bottom). (C) Normalized cross-correlograms of MUA in right vs. left hippocampus within the time window of eSPWs (left) and during non-eSPW epochs (right). Cross-correlograms were normalized to the maximum value during eSPW epochs. (B,C) Group averages from three animals. Shaded areas show confidence intervals. MUA PETHs, z-scores and cross-correlograms were smoothed using a 20 ms-long sliding window.

