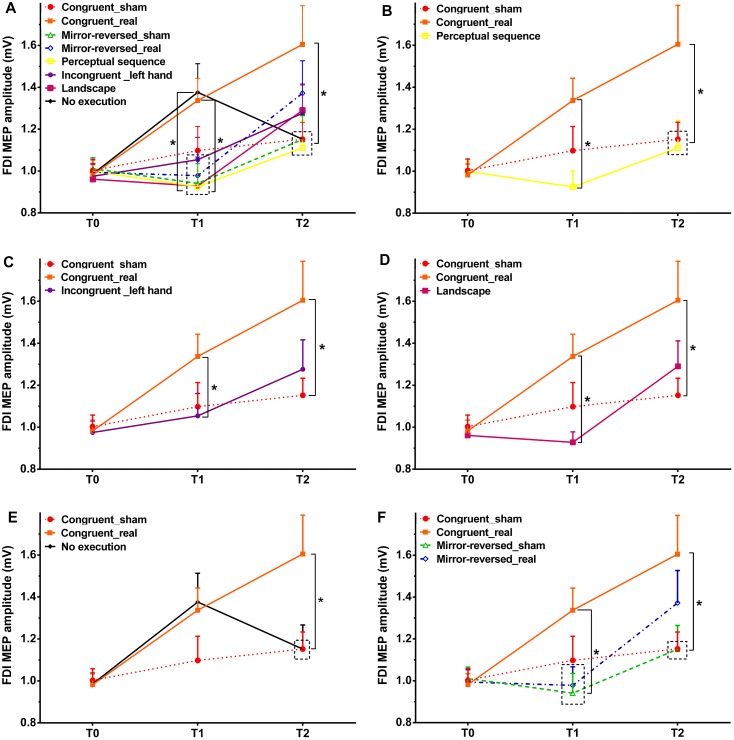
FIGURE 2.
Size of the MEP amplitudes of the FDI muscle before action observation, observing the perceptual sequence or watching a landscape combined with tRNS (T0), as well as immediately after action observation (T1), and after action execution or no execution (T2) in each intervention. Congruent = Experiment 1, Mirror-reversed = Experiment 2, Perceptual sequence = control Experiment 1, Incongruent (left hand) = control Experiment 2, Landscape = control Experiment 3, No execution = control Experiment 4. Sham – sham tRNS, Real – real tRNS. Error bars represent standard error. ∗Denotes significant differences between groups (∗p < 0.05). (A) Comparison of MEP amplitudes across all experiments. In order to improve comprehension of A, each experiment is presented separately. Comparison of MEP amplitudes between Experiment 1 and control Experiment 1 (B), control Experiment 2 (C), control Experiment 3 (D), as well as control Experiment 4 (E). (F) Comparison of MEP amplitudes between Experiment 1 and Experiment 2.

