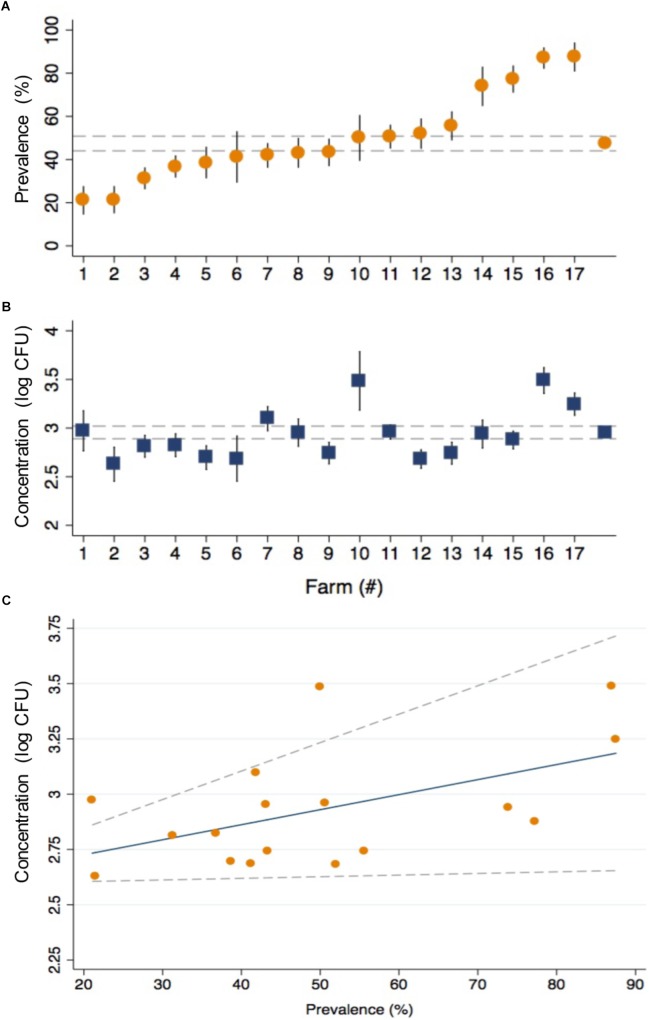
FIGURE 2.
The prevalence and concentration of CRB in beef cattle from 17 cow/calf operations in North and Central Florida. The prevalence (A) and concentration (log10 CFU) (B) of CRB detected in the fecal samples collected from calves and cows are presented with the corresponding standard error (black spike) for the 17 sample collection sites along with the average values from all farms (gray dashed lines). The relationship (C) between the concentration (log10 CFU) and prevalence of CRB is presented as a scatter plot for the values obtained by farm (orange circles), with the predicted values from a linear regression model (blue line) and 95% confidence intervals (gray dotted lines).

