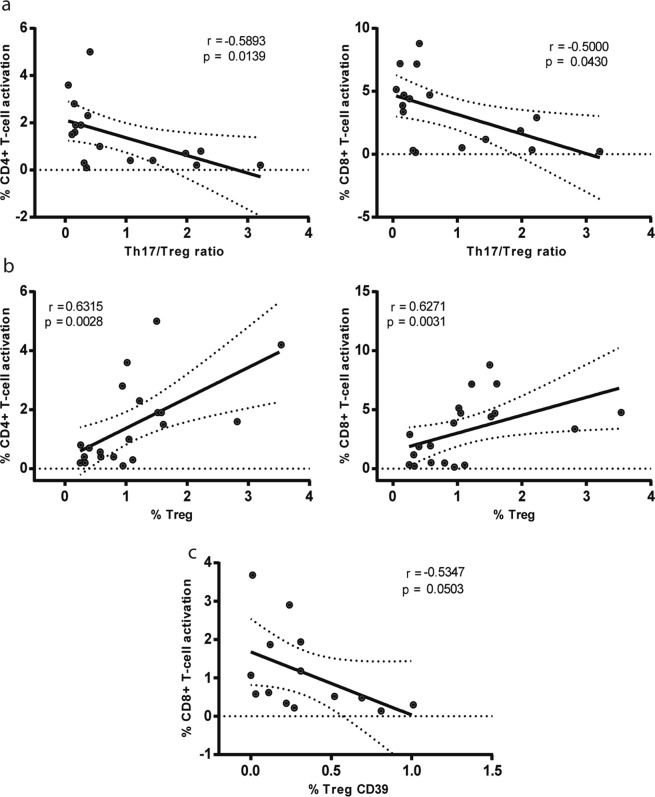
Figure 2.
T-cell activation magnitudes in HIV+ ART+ were positively correlated with proportion of total Treg-cells and indirectly with functional Treg (%Treg CD39) and Th17/Treg levels. Correlations found among HIV+ ART+ patients. (a) Th17/Treg ratio versus (vs) %CD4+ T-cell activation (left panel) and vs %CD8+ T-cell activation (right panel); (b) %Treg vs %CD4+ T-cell activation (left panel) and vs %CD8+ T-cell activation (right panel) and (c) %Treg CD39+ vs %CD8+ T-cell activation. Symbols represent individual patients: HIV+ ART+ (◉). All r and p values correspond to Spearman’s correlations.

