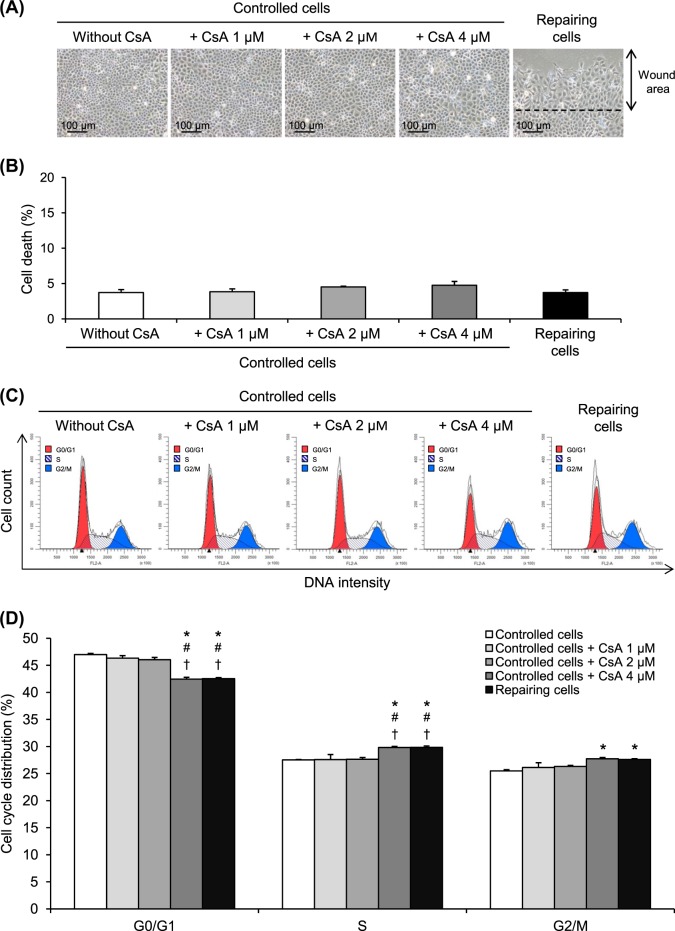
Fig. 4. Cell cycle shift by CsA at non-toxic doses.
a The confluent cell monolayers were treated with 1, 2, or 4 µM CsA for 12 h. Original magnification = ×200 for all panels. b The cells were then subjected to cell death analysis comparing to repairing and controlled cells. c,d Cell cycle analysis was performed on CsA-treated cells compared to repairing and controlled cells. Each bar represents mean ± SEM of the data obtained from three independent experiments. *p < 0.05 vs. controlled cells; #p < 0.05 vs. 1 µM CsA-treated cells; †p < 0.05 vs. 2 µM CsA-treated cells

