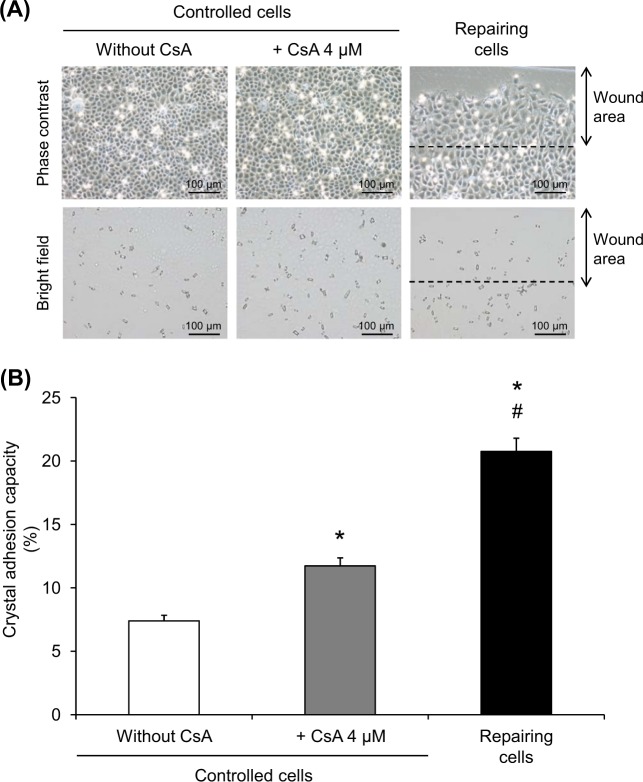
Fig. 5. Enhanced crystal adhesion capacity of CsA-treated cells.
a COM crystal-cell adhesion assay was performed on the controlled, repairing, and CsA-treated cells at 12-h post-scratch or post-treatment. Micrographs were taken by using a phase contrast microscope (original magnification = ×200 in all panels). b Crystal adhesion capacity of the cells was examined from at least 15 randomized high-power fields (HPFs) in each well. Each bar represents mean ± SEM of the data obtained from three independent experiments. *p < 0.05 vs. control; #p < 0.05 vs. 4 µM CsA-treated cells

