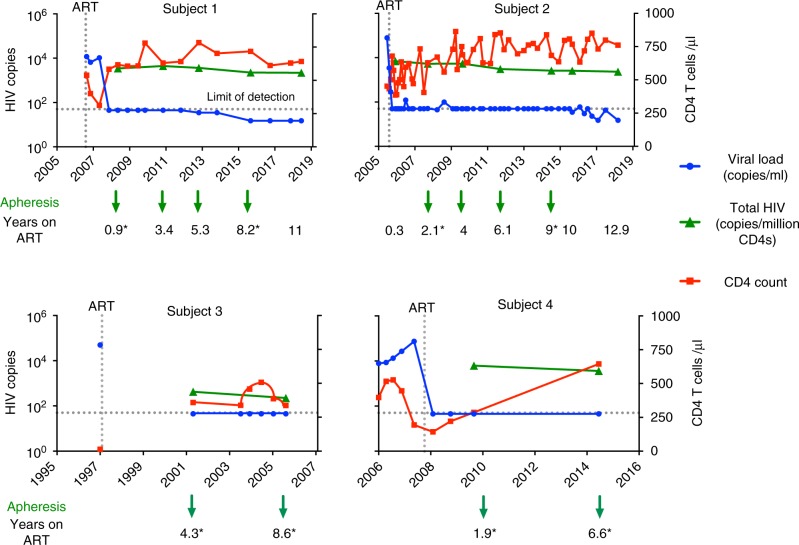
Fig. 1.
Longitudinal parameters of four subjects over time on ART. Longitudinal levels of plasma HIV-1 RNA (blue), total HIV DNA (green), and CD4 T cell counts (red). For each subject, peripheral blood mononuclear cells (PBMCs) were collected by apheresis at the time points indicated in the graph. The arrows identify the time points we used for sequencing of both intact and defective proviruses, while for the remaining time points only near-full-length proviruses were sequenced. Asteriks identify the time points used for the deletion maps in Fig. 4. Total HIV DNA was quantified by primers binding to the long terminal repeat region of HIV-1. Values are normalized to CD4 T cell count and presented as log copies of HIV per million CD4 T cells. HIV RNA is presented as copies per ml blood

