
Fig. 2.
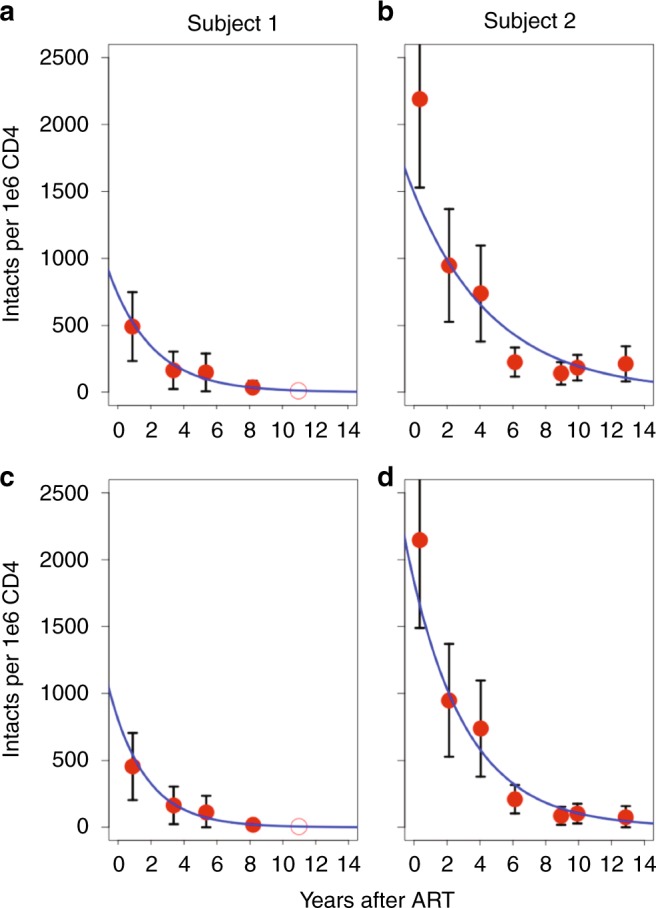
Dynamic changes of intact proviruses over time. a Frequency of intact proviruses after initiating treatment for Subject 1 measured by intact copies per million CD4 T cells. Red circles represent intact proviruses calculated by multiplying the concentration of total HIV DNA per CD4 by the frequency of sequenced proviruses that were intact. b Frequency of intact proviruses for Subject 2. c Frequency of intact proviruses for Subject 1 when counting clones only the first time they were detected in order to minimize the effects of clonal expansion. d Frequency of intact proviruses in Subject 2 with clones counted only once, when they first appeared. We included five time points for Subject 1 and 7 for Subject 2. For Subject 1, we did not identify any intact provirus in 2018, and therefore this time point is presented as an open circle. Black bars signify 95 percent confidence interval of the mean based on a binomial process with approximately 100 sequences per time point. The blue line is the estimated decay based on a exponential decay model