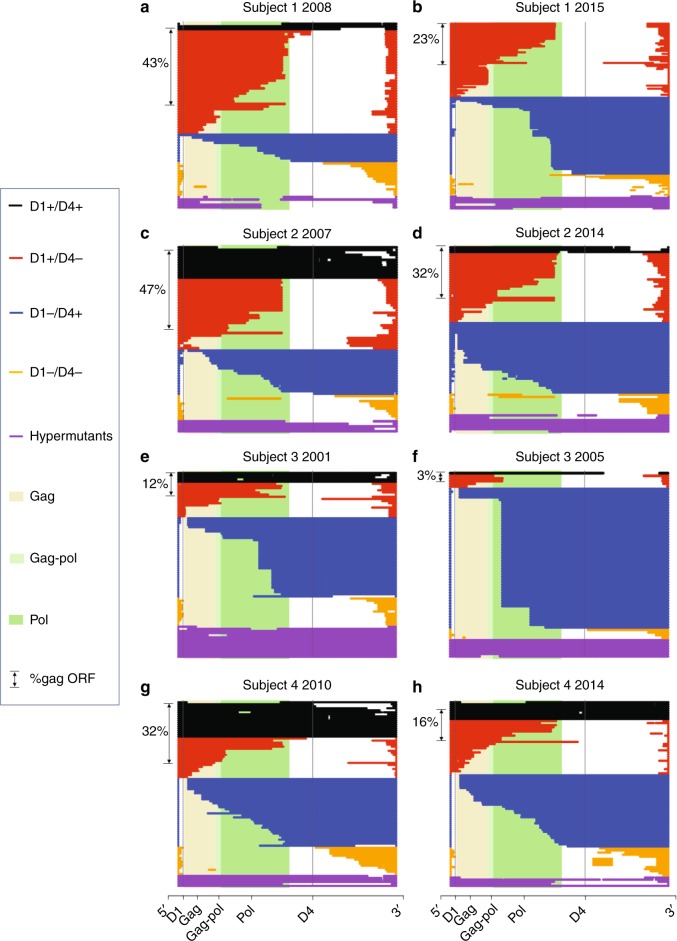
Fig. 4.
Deletion analysis reveals a role for splicing in reservoir dynamics. a Defective proviruses from an apheresis sample collected from Subject 1 in 2008 (~1 year of ART) are aligned to HXB2. In order, from top to bottom, black proviruses are D1+ D4+, red proviruses are D1+ D4−, blue proviruses are D1− D4+, and gold proviruses are D1−D4-. Hypermutated proviruses are represented in purple. The shaded beige, light green, and dark green regions correspond to the gag, gag-pol, and pol regions of HXB2, respectively. On the left side of panels a–h we show the percentage of defective proviruses containing a complete Gag ORF. b Defective proviruses from Subject 1 for the apheresis sample collected in 2015 (~8 years of ART). Proviruses are graphed on the same scale to demonstrate how the proportion of each type of defective proviruses changed from first to last time point. c, d Defective proviruses from Subject 2 for the apheresis sample collected in 2007 (~2 years of ART) and in 2014 (~9 years of ART). e, f Defective proviruses from Subject 3 for the apheresis sample collected in 2001 (~4 years of ART) and in 2005 (~9 years of ART). g, h Defective proviruses from Subject 4 for the apheresis sample collected in 2010 (~2 years of ART) and in 2014 (~7 years of ART). The time points used for the deletion maps are identified by asterisks in Fig. 1. The first black provirus depicted in a contains a D1 and terminates within the gag ORF, but this is obscured due to imperfect R-coded filtering

