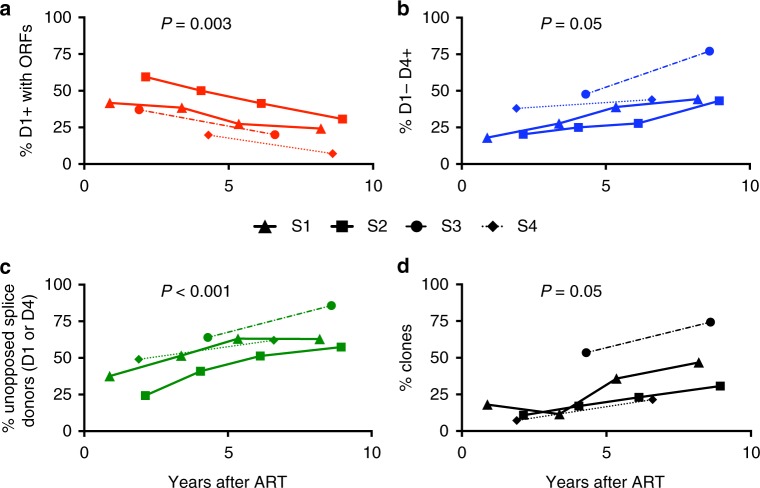
Fig. 5.
Relative changes in the major splice sites donors reveal selection pressures. a Percentage of defective proviruses with D1 splice site and at least one ORF over time on ART (red). b Percentage of intact D4 splice site sequence in defective proviruses lacking 5′ D1 at the same time points. These proviruses are predicted not to express proteins efficiently due to a truncated 5′UTR (blue). c Percentage of defective proviruses with unopposed strong donor splice site, i.e. D1+ without ORFs or D1−D4+ at the same time points (green). d Percentage of clones over time in defective proviruses (black). Estimations of a common slope for these data were done using a linear random-effects regression model, assuming each subject had a different intercept at the initiation of ART. To test for the statistical significance of this effect, a statistical analysis based on a type III Anova was performed. The time points used for the analysis of the deleted proviruses are identified by arrows in Fig. 1

