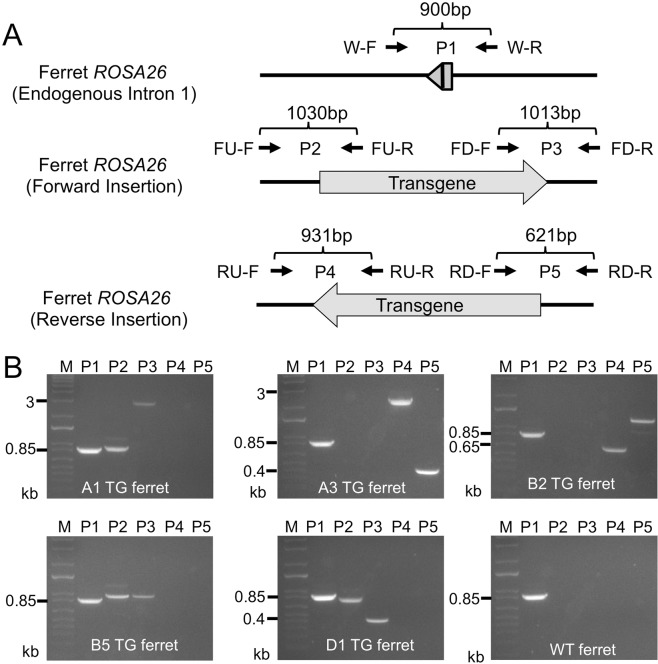
Figure 3.
Genotyping of transgene integration and orientation by PCR analysis. To map the orientation of the transgene integration events at the ROSA26 locus and to characterize indels at the 5′ and 3′ junctions of the insertion site, genomic DNA from F0 founders with observed en face tdTomato expression and non-transgenic wild-type ferrets were analyzed for transgene integration using a PCR assay. (A) Schematic of the PCR strategy and primers used for mapping the direction of integration events. (B) Representative gel images of PCR products (P1-P5) for the indicated transgenic (TG) founder ferrets and a non-transgenic wild-type (WT) animal (see Table 2 for primer descriptions). The predicted sizes of PCR products varied among distinct TG ferret founders due to different sized indels generated from error-prone NHEJ-mediated integration. The sizes of these indels were confirmed by Sanger sequencing of the PCR products (Fig. 4). M, lane denotes 1 kb plus marker.

