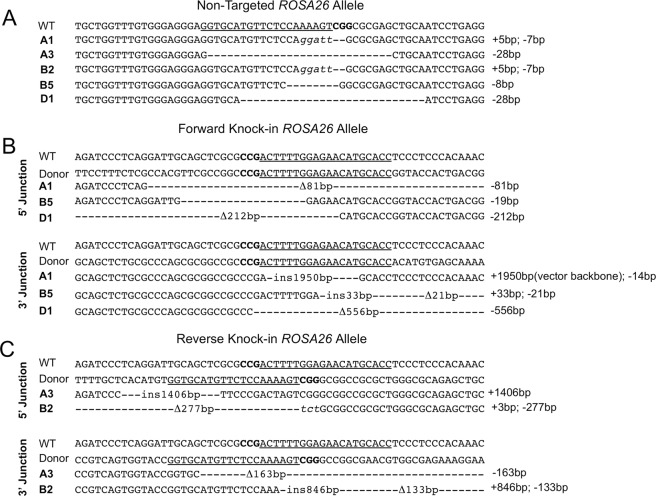
Figure 4.
Characterization of indels at the transgene integration sites. The PCR-specific amplicons as shown in Fig. 3 were gel extracted and analyzed by Sanger sequencing. (A) Indels created at the non-targeted ROSA26 locus for the indicated founder animals. (B,C) Indels created at the targeted ROSA26 locus for (B) forward and (C) reverse integration events. Wild-type and donor sequences are shown at the top with the targeting gRNA site underlined and protospacer adjacent motif (PAM) sequences bolded. The dash lines denote deletions (Δ) and insertions (ins) with the number of nucleotides indicated. Italics font denotes mutations at the indel site.

