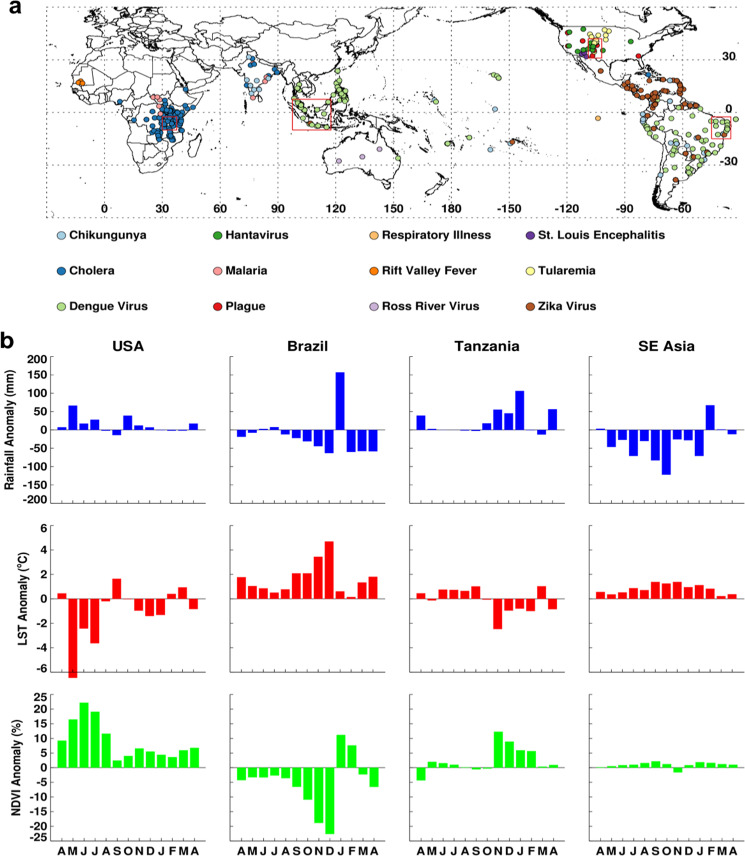
Figure 2.
Geographic distribution of various disease activity worldwide (between April 2015–March 2016) compiled from various sources (a) and time series profiles of climate variables (b) for each box in (a). Persistence of anomaly conditions of precipitation, land surface temperature, and normalized difference vegetation index in (b) created conditions for the emergence of vectors and outbreaks of diseases for United States, Brazil, Tanzania, and Southeast Asia focal regions in (a). This figure was created using Interactive Data Language (IDL) software (version 8.6.0) (www.harrisgeospatial.com/SoftwareTechnology/IDL.aspx).

