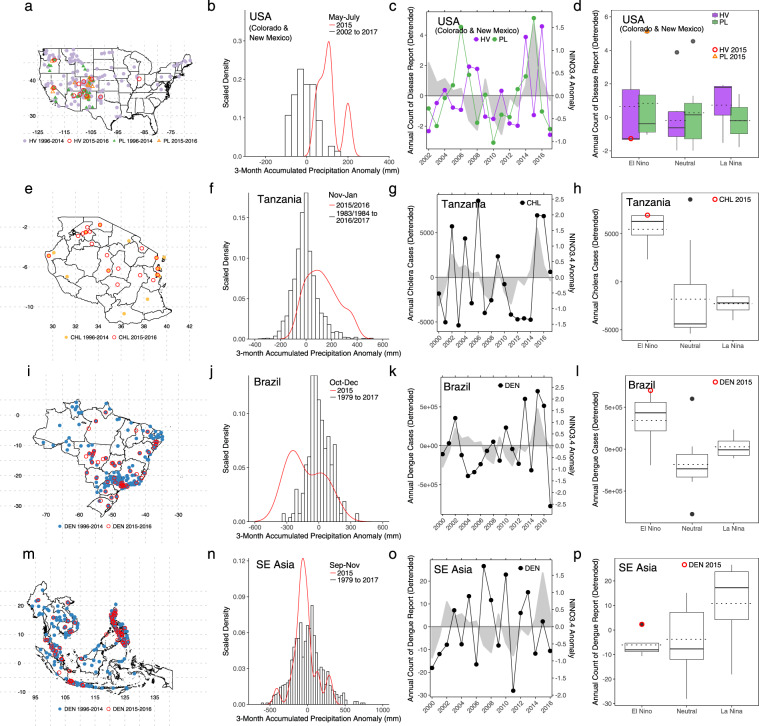
Figure 4.
Selected regional disease outbreaks and climate conditions for hantavirus (HV) and plague (PL) in the United States (a–d); cholera (CHL) in Tanzania (e–h); dengue (DEN) in Brazil (i–l); dengue (DEN) in Southeast Asia (m–p). Maps in the first column show the locations of reported disease occurrences during April 2015 to May 2016 El Niño event, overlaid on the locations of the same diseases occurring between 1996 and 2014. Histograms in the second column show rainfall anomaly distributions for locations with reported disease occurrences during the specified season in the 2015/2016 El Niño year. Time series plots in the third column represent each disease intensity over the years while the shaded plot denote annual NINO3.4 anomaly. Boxplots in the fourth column show the distribution of each disease intensity as categorized by the ENSO events. Here solid black lines represent the median value, dotted lines the mean value, and the circles are the disease intensity during 2015/2016 El Niño year. This figure was created using R software (version 3.4.1)79.

