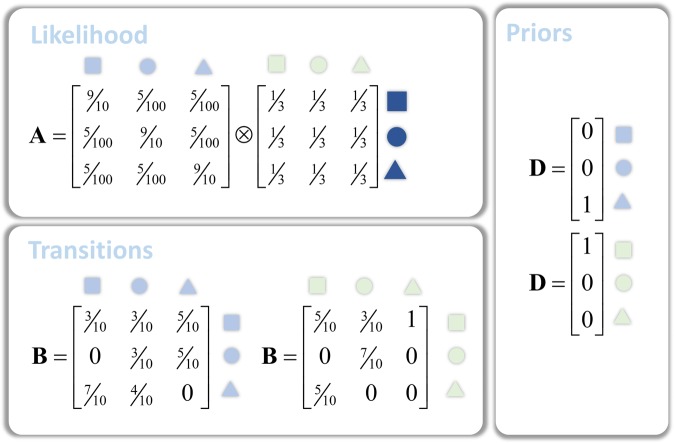
Figure 8.
Probability distributions for simulated HMM. The probability distributions here make up the generative model we used to simulate neuronal message passing under both schemes. These probabilities have been chosen to make several points. Firstly, we separated the hidden state into two distinct state factors (light blue shapes and light green shapes). This allowed us to generate data (darker blue shapes) that depends upon only one of these (light blue). The likelihood mapping illustrates how data are (probabilistically) generated from these states (). We used deterministic priors for the initial states () and stochastic transitions ().

