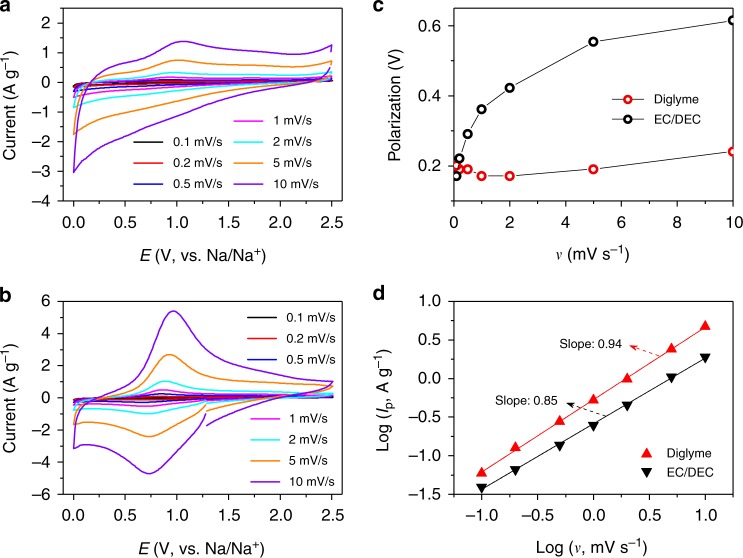
Fig. 3.
Scan rate-dependent cyclic voltammetry (CV) from the 3-electrode tests (see the experimental setup in Supplementary Figure 12). a, b CV curves of the TiO2 anode at different scan rates with the EC/DEC-based electrolyte (a) and the diglyme-based electrolyte (b). c Separation (potential polarization) between the cathodic and anodic peaks in the CV curves as a function of scan rate. d b-values (slopes) obtained from the current peaks, Ip = avb, of the CV curves

