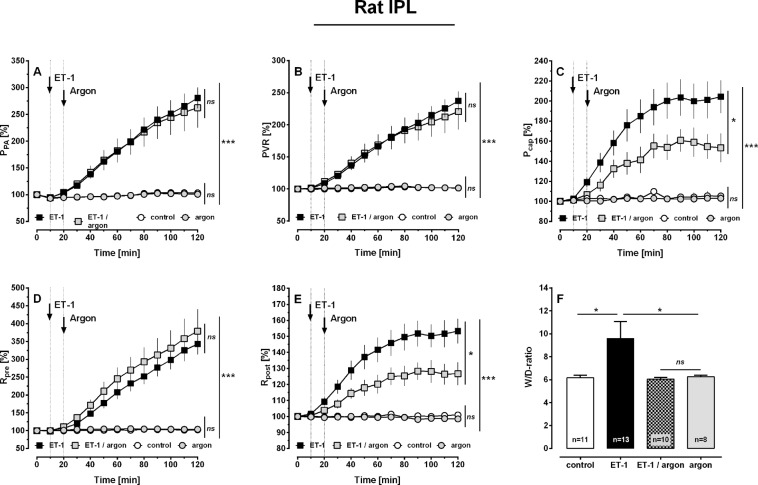
Figure 1.
Influence of argon on pulmonary haemodynamics in the IPL of the rat. (A) Pulmonary arterial pressure (PPA); (B) PVR; (C) Pulmonary capillary pressure (Pcap); (D) Precapillary resistance (Rpre); (E) Postcapillary resistance (Rpost) and (F) Wet-to-dry ratio (W/D). (A–E) (○) control (n = 12), ( ) argon (n = 13) (■) ET-1 20 nM (n = 10), (
 ) ET-1 20 nM/argon (n = 8). Statistics were performed by a LMM (A–E) or by the Mann-Whitney U test (F). *p < 0.05, **p < 0.001 and ***p < 0.001.

