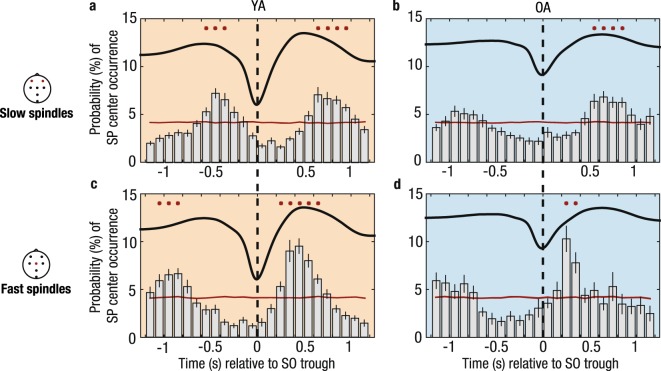
Figure 3.
Temporal specificity of fast and slow SP occurrence. Peri-event time histograms of fast and slow SPs co-occurring with frontal SOs are depicted for both age groups. Standard errors of the 100-ms bins are included as black vertical lines. Reference distribution obtained after randomization of the data is shown in red. Red asterisks indicate significantly increased SP occurrence contrasted with the reference distribution (cluster-based permutation test, cluster α < 0.05, positive clusters only). Vertical dashed lines mark the SO trough. Average SOs are shown for each age group. (a) Frontal slow SPs in younger adults globally peak at the up- to down-state transition. (b) The frontal slow SP peak at the up- to down-state transition preceding the SO trough observed in younger adults disappears in older adults. (c) In younger adults, fast SPs prominently peak during the SO peak (SO peak at 480 ms, significant positive cluster: 200–700 ms). (d) In older adults, fast SPs are similarly modulated during the SO up-state as observed in younger adults but their occurrence is maximized before the SO has peaked (SO peak at 618 ms, significant positive cluster: 200–400 ms). YA: younger adults; OA: older adults; SO: slow oscillation; SP: spindle.

