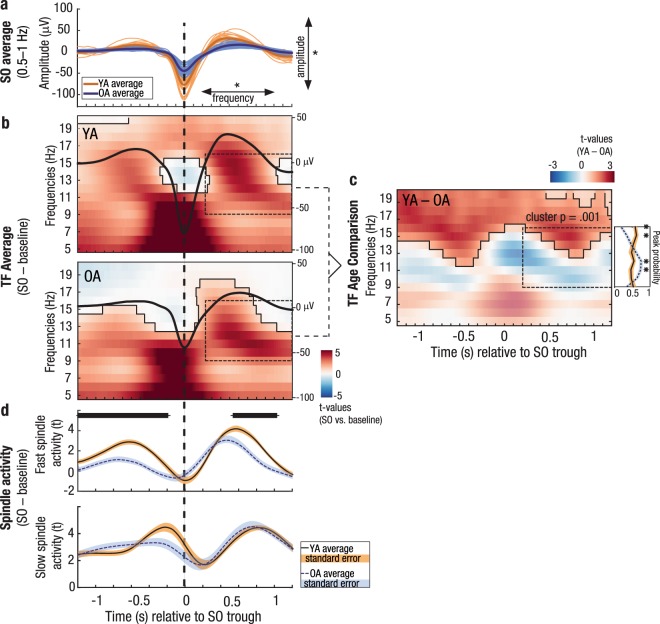
Figure 4.
SO–SP coupling is differentially expressed in younger and older adults. (a) Average frontal SOs are depicted for each younger (light orange) and older (light blue) individual. In older adults, the amplitude of SOs is reduced and the frequency is decreased. (b) Differences in wavelet power for SO trials (respective trough ± 1.2 s) compared to baseline trials without SOs are depicted (in t-score units, reference window for later analyses outlined by dashed black line). Significant clusters (cluster-based permutation test, cluster α < 0.05) are highlighted and outlined. The average frontal SO for each age group is shown in black (the scale in μ is indicated on the right of each time–frequency graph). In both age groups, EEG activity is modulated as a function of the SO phase. (c) Time–frequency t-map illustrating reliable age differences in SO-related power increases compared to baseline trials (cluster p < 0.001). Significant age differences in fast SP power modulation are tied to the SO up-states. The probabilities of frequency peaks (maximal t-values) across time (reference window outlined by dashed black line) are shown in the line plot to the right. In older adults the probability of high fast SP activity is significantly reduced during the SO up-state. In contrast, compared to younger adults, a strong increase in slow SP frequencies is more likely (right line plot, all clusters: p ≤ 0.007, marked by asterisks). (d) Temporal evolution of SO-specific power modulations (expressed in t-values) in the slow and fast SP range extracted from the time–frequency maps above. In older adults, compared to younger adults, SO-specific fast SP activity is significantly reduced during and following the SO peak (significant clusters marked in black). YA: younger adults; OA: older adults; SO: slow oscillation; SP: spindle; TF: time–frequency.

