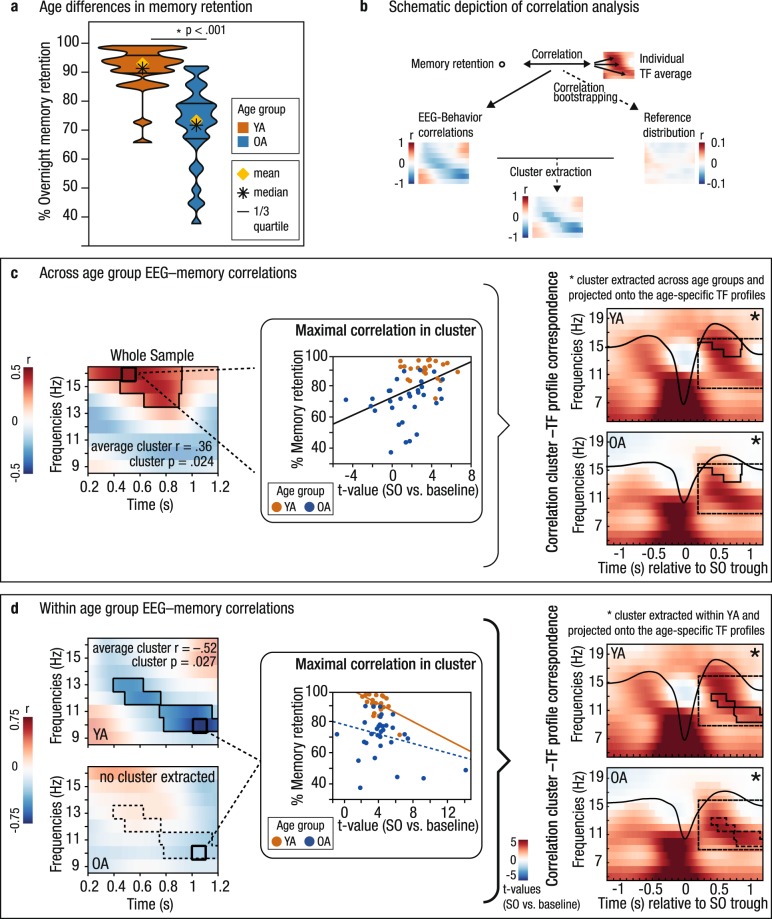
Figure 5.
SO–SP coordination relates to memory retention. (a) Age-specific distribution of memory retention in younger (orange) and older adults (blue). Older adults’ overnight memory retention is significantly reduced. (b) Extraction of significant correlation clusters between SO-specific EEG activity and memory retention was achieved by contrasting a test statistic (i.e., the correlation for each time–frequency point) against a reference distribution of bootstrapped EEG–behavior correlations. (c) Left: Correlations between memory retention and neuronal activity during SO up-states are shown for the whole sample (significant positive correlation cluster highlighted and outlined). Middle: Maximal positive correlation between SO-related power modulations (t-values) and memory retention in the cluster (least-squares fit line shown in black). Right: Correspondence between the correlation cluster (outlined in black) and the age-specific time–frequency profiles (reference window for the correlation analyses marked by dashed black line). Fast SP activity during the SO peak, that is typically more expressed in younger adults, is related to better memory retention. (d) Left: In younger adults, a significant negative correlation cluster (highlighted and outlined) was detected. Middle: Maximal negative correlation between SO-related power modulations (t-values) and memory retention in the cluster extracted within YA. For completeness, the corresponding association within OA is depicted as well. Right: Correspondence between the correlation cluster extracted within YA and the age-specific time–frequency profiles. The significant cluster found in younger adults corresponds to the power increases typical for older adults. Note. Scatter plots only serve illustrative purposes. Hence, no significance is stated in the respective subplots. YA: younger adults; OA: older adults; SO: slow oscillation; SP: spindle; TF: time–frequency.

